

Understanding Chart Patterns for Traders
📈 Master chart patterns used by South African traders and local platforms. Understand formations, psychology, and tips to improve your trading decisions effectively.
Edited By
Amelia Foster
Understanding stock chart patterns is central to making informed decisions in trading and investment. These patterns reveal the psychology behind market moves, showing how supply and demand shift over time. But more than just spotting these shapes on a screen, having printable stock chart patterns gives traders the freedom to study them even when offline—no need to be glued to a laptop or mobile.
Printable charts serve as handy references, especially useful when you’re analysing with pen and paper or discussing strategies in meetings. This guide focuses on key patterns every trader should know, from basic to advanced, along with advice on how to interpret them quickly and effectively.

Compared to digital-only formats, printed patterns allow for better retention and less screen fatigue. Traders can mark, annotate, and repeatedly review patterns at their own pace. For example, a Johannesburg-based day trader might keep a small set of laminated patterns at their desk, while a consultant travelling to client indabas can use printed handouts to explain trends without relying on data connections.
You'll encounter common formations like:
Head and Shoulders: Signals a potential trend reversal, especially reliable on daily charts.
Double Tops and Bottoms: Confirm attempts to break key support or resistance.
Triangles (ascending, descending, symmetrical): Indicate potential breakout zones, useful for setting stop-loss levels.
Additionally, we'll explore lesser-known but valuable patterns such as the Cup and Handle and Rising Wedge, detailing their setups, typical duration, and how volume patterns support their validity.
"Well-understood chart patterns can help anticipate price moves but require combining with volume and broader market context. Always print and use patterns as part of a toolkit — not in isolation."
Keep charts updated with recent examples from local or global markets.
Practise drawing patterns yourself to reinforce recognition skills.
Use different coloured pens to highlight support, resistance, and breakout points.
Combine printed patterns with other analysis forms, like fundamental insights or economic indicators relevant to South Africa’s market.
This practical focus aims to equip traders, investors, and analysts with accessible tools for sharper market reading—making the complex world of stock movements a bit easier to navigate on paper and beyond.
Stock chart patterns form the backbone of technical analysis in trading. They offer a visual way to track price movements over time, which helps traders anticipate future shifts. Understanding these patterns enables you to spot potential opportunities and risks in the market, potentially improving your timing for entering or exiting trades.
Stock chart patterns are recurring formations created by price movements on a chart, visible over various timeframes – from minutes to months. These patterns help traders detect trends, reversals, or periods of consolidation. For example, a simple 'double top' pattern often signals a trend reversal from bullish to bearish, warning traders to possibly sell or tighten stops.
The purpose of chart patterns is to standardise the interpretation of market data, allowing traders to make informed decisions based on past market behaviour. They're not foolproof but provide a framework rooted in historical price action.
Market psychology drives these patterns. When buyers and sellers react repetitively under similar conditions, predictable price shapes emerge. For instance, a 'head and shoulders' pattern often reflects a shift in trader sentiment from optimism to caution, as buying interest falters and selling pressure mounts. Recognising this sentiment helps traders align themselves with the prevailing market mood.
Despite the rise of digital tools, printable charts retain unique advantages. They provide a tangible, distraction-free view of market data that many traders find easier to analyse. Handling a printout encourages deliberate study, fostering a deeper understanding of the pattern rather than quick scrolling on a screen.
Printouts also allow you to annotate freely — jotting notes, circling breakout points, or marking support and resistance lines with ease. This physical interaction often enhances memory retention and sharpens analysis.
Specifically, printable charts prove invaluable in situations where screen access is limited or when preparing for meetings or discussions. For example, traders attending in-person indabas or team meetings can share annotated printed charts, making communication smoother. Furthermore, during phases of heavy data use or power disruptions (like loadshedding), having printed charts ensures uninterrupted access to critical market information.
Having a hard copy of key stock chart patterns can improve your trading focus and decision-making, especially in environments where technology might falter or distractions abound.
To conclude, understanding stock chart patterns and pairing that knowledge with printable charts equips traders with practical tools to better navigate market complexity. By bridging the technical with the tangible, you gain clear, actionable insights essential for confident trading decisions.
Stock chart patterns offer a visual shorthand to understand market behaviour. Printing these patterns helps traders and analysts by providing a tangible reference that can be marked, highlighted, or studied without toggling screens. This hands-on approach often sharpens focus during decision-making, especially in fast-moving or volatile markets.
Triangles show areas where price movement narrows between converging trend lines. An ascending triangle, for example, slopes upwards on the bottom line, suggesting buyers are gaining strength and a breakout upwards is likely. Conversely, a descending triangle often signals that sellers are preparing to push prices down. Symmetrical triangles indicate a squeeze where the market is equally poised to break either way.
Printed triangle charts help spot these tightening ranges easily, aiding in pinpointing entry points. If a trader notices an ascending triangle forming on a printed daily chart of a stock like Sasol, they might anticipate a buying opportunity once the price breaks its upper trend line.
These are short-term continuation patterns appearing after a strong price move. Flags show a small rectangular pause that slopes against the prevailing trend, while pennants look like small symmetrical triangles. Both suggest brief pauses before the trend resumes.
Having printed flags and pennants nearby can help confirm momentum in price action. For example, if a MTN share rallies sharply and forms a pennant, printing this pattern allows a trader to monitor for the breakout more closely, avoiding missing the resumption.
The head and shoulders pattern signals a reversal after an uptrend, made up of two smaller peaks (shoulders) with a higher peak (head) in between. The inverse happens after a downtrend, hinting prices will climb soon.
Printing these patterns provides clarity by allowing traders to mark neckline breakouts and measure price targets, which are crucial for timing entries or exits.
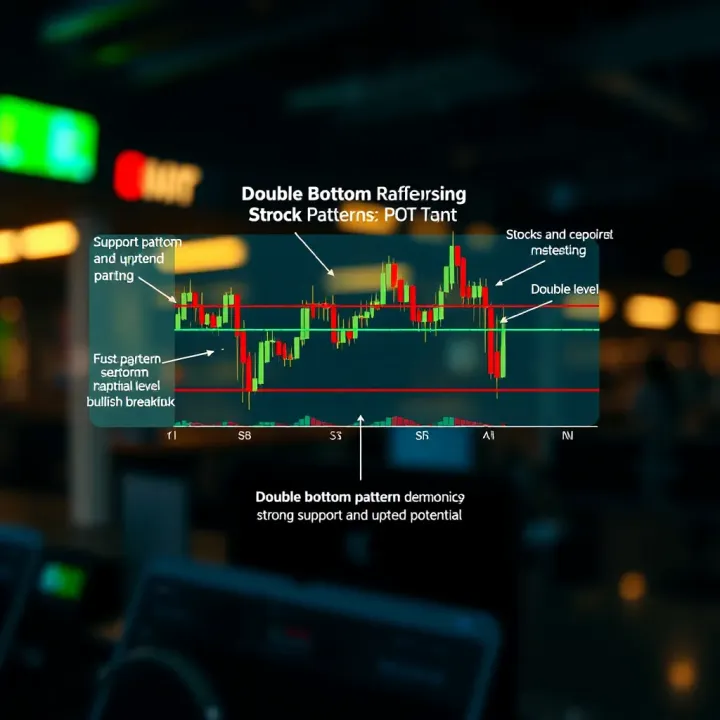
These occur when price hits a resistance or support level twice but fails to break through, pointing to possible reversals. In a double top, two peaks form near the same price level; in a double bottom, two troughs do the same.
A printed double top chart of Shoprite shares, for instance, may alert a trader to possible selling pressure if the neckline breaks down. Conversely, double bottoms can indicate good buying points.
Less common but reliable, these patterns extend the double top/bottom concept with three peaks or troughs at roughly the same levels. They often reinforce the reversal signal's strength.
Printing triple top/bottom patterns helps traders visualise multiple tests of key levels, which may be hard to track on-screen during hectic sessions.
Rectangles form when price oscillates between well-defined support and resistance, reflecting indecision. This sideways movement—often called ranging—can last days or weeks.
Printed charts highlighting rectangles help traders plan trades within range bounds or prepare for breakouts by pinpointing entry and stop-loss areas.
Channels are parallel trend lines containing price movement. An upward channel shows steady climbs, while a downward one signals declines. Sideways channels act like extended rectangles.
A printed price channel for a stock like Discovery could assist a trader by clarifying buying near channel support and selling near resistance, helping to manage trades within well-understood boundaries.
Having a physical printout of these common chart patterns turns abstract lines into actionable guides. They ease rapid identification and reduce the risk of misreading charts on digital devices prone to distractions or screen limitations.
By understanding and printing these patterns, you stand a better chance of spotting key moments in stock movement and making informed trading decisions.
Printed stock charts create a tactile way to study price trends and market psychology. Holding a physical chart allows traders to clearly mark, annotate, and compare patterns without the distractions of screen glare or multiple tabs. For many, seeing the actual lines and volumes on paper improves focus and decision-making during analysis sessions.
Compared to digital screens, printed charts offer a fixed snapshot of price action, making it easier to recognize and interpret critical support and resistance levels, volume changes, and breakout signals in familiar ways. This approach helps traders avoid clicking through various charts and potentially missing nuanced changes.
Support and resistance lines anchor printed charts by highlighting price levels where stocks repeatedly find buyers or sellers. Support marks the zone where buying interest prevents further declines, while resistance signals sellers stepping in to cap upward moves. On a printed chart, these horizontal or slanting lines are clear reference points to assess entry and exit points. For example, if a share price bounces off a support line multiple times, it indicates strong backing at that level, making it a safer entry point.
Traders can also draw trendlines linking highs or lows to track momentum shifts. Marking these on printed charts provides a constant visual reminder of key price zones, helping to avoid rushed trades during volatile swings.
Volume changes and breakout indicators add depth to the pattern interpretation. Sudden volume spikes often precede or confirm breakouts from chart patterns like triangles or rectangles. On paper, colouring or highlighting volume bars can make these shifts stand out more clearly than on a digital screen cluttered with numerous indicators.
For instance, if a pennant pattern breaks resistance with a notable increase in volume, the printed chart signals higher conviction behind the move, suggesting a stronger trade setup. Recognising these volume cues on printouts helps traders confirm whether price moves are supported by genuine market interest or are just short-lived blips.
False breakouts occur when prices briefly move past support or resistance but then quickly reverse. Printed charts help flag such fakeouts by letting traders review past instances where breakouts failed. By noting these occurrences, traders can add caution flags next to suspected breakout zones and avoid entering trades prematurely.
For example, a stock might break above a resistance line on a chart but retreat below it within a day. A printed chart aids the trader in spotting this pattern historically, warning against jumping in during weak breakouts.
Pattern failures and what to watch for are common pitfalls. Not all patterns lead to expected moves; some dissolve or invalidate due to broader market shifts or news events. Printed charts make it easier to mark aborted patterns and record why trades did not work out, fostering better learning.
Watching for divergences between volume and price, or price failing to reach projected targets after pattern completion, helps traders stay alert to these failures. Recording these observations on printed charts encourages a disciplined approach rather than chasing every signal blindly.
Using physical charts encourages deliberate analysis, providing space to mentally step back and rethink trading decisions rather than react on instinct alone. This quiet reflection often makes the difference between rash losses and well-timed trades.
Printed charts are thus more than just static images; they become active tools that sharpen pattern recognition, highlight crucial market signals, and prevent common errors in technical trading.
Using printable stock chart patterns effectively can significantly improve your trading outcomes. Printed charts offer a tactile way to analyse trends and signals without struggling with screen glare or digital distractions. They also let you annotate directly, which helps in tracking observations over time or across market conditions.
Sources of charts tailored for printing include specialised financial websites, brokerage platforms, and even some trading software that allows exporting charts in high resolution. For example, platforms like TradingView offer downloadable charts or templates designed with clear print layouts—crucial for retaining details like volume bars and support lines when printed.
Local financial portals or technical analysis blogs often share templates customised for South African markets, which can include JSE-listed shares and applicable indicators. Selecting templates with clean designs and clearly marked axes ensures prints are practical and easy to analyse away from your computer.
Customising charts for specific needs means tailoring elements such as time frames, indicators, and annotations before printing. For instance, if you focus on day trading, you might print shorter time frames like 15-minute or 30-minute intervals highlighting key breakout points. Longer-term investors might prefer daily or weekly charts with moving averages overlaid.
Customising also involves adapting chart size and orientation, ensuring they fit notebooks or binders you use for tracking. Some traders highlight critical patterns or add manual notes straight onto prints to complement their digital records—making the physical copy an active part of their workflow.
Combining patterns with other analysis tools is essential to avoid relying solely on visual shapes. Printed charts are handy for comparing with indicators like the Relative Strength Index (RSI) or Moving Average Convergence Divergence (MACD), which you can note on the side or print on accompanying pages. This combined look provides a fuller picture before making entry or exit decisions.
For example, spotting a head and shoulders pattern on a printed chart alongside declining volume and a bearish RSI divergence can reinforce the signal's strength.
Recording trades using printed charts helps build a physical log of your trading journey. You could mark entry points, stop-loss levels, and exit prices directly onto the chart printouts, plus jot brief notes on your reasoning or emotions. This habit promotes discipline and retrospective analysis, which are often missing from digital-only setups.
Such records provide a visible progression of your strategy’s success or flaws over weeks or months. Traders in Gauteng have found printing charts useful during loadshedding periods, keeping analysis active even without power or reliable internet access.
Keeping printed stock chart patterns well-organised allows you to refer back repeatedly, turning your notes into a personalised trading manual that grows with experience.
By sourcing good templates, customising prints to your style, and using these charts alongside digital tools and record-keeping, you’ll create a robust and hands-on approach to technical trading.
📈 Master chart patterns used by South African traders and local platforms. Understand formations, psychology, and tips to improve your trading decisions effectively.

📈 Master key forex chart patterns to boost your trading skills. Learn to spot formations, assess market moves, and make smarter decisions tailored for South African traders.

📈 Master key chart patterns traders use across South African markets. Learn to spot trends, interpret signals and make informed trading moves with practical tips.

📉 Learn to spot hammer candlestick patterns to catch market reversals. Discover signal insights, pattern variations, & tips for sharper trading moves.
Based on 6 reviews